Essay
A new printing machine is set or calibrated to print 25 copies per minute. On each of four days, the printer's output is measured five times. The data will be used to construct a process control chart to monitor the printing process. The results of the printing process are in the following table. 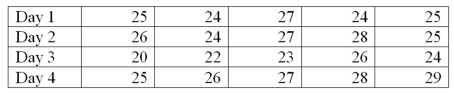 What is the value of A2, the control limit factor for averages?
Correct Answer:

Verified
0.577
Explanation: U...View Answer
Unlock this answer now
Get Access to more Verified Answers free of charge
Correct Answer:
Verified
Explanation: U...
View Answer
Unlock this answer now
Get Access to more Verified Answers free of charge
Q27: A fishbone diagram is used to determine
Q40: Which probability distribution is used to develop
Q45: A curve that graphs the percent defective
Q64: A Pareto chart is useful because it
Q65: The manager of a restaurant measures several
Q66: A _ chart portrays the number of
Q66: Which probability distribution is used to develop
Q67: In acceptance sampling, the risk of accepting
Q68: A major distributor buys shoes from a
Q71: A large restaurant contracts with a local