Essay
The following table shows the sales for a plastics manufacturer recorded over the past year. The seasonal indexes for each quarter are also provided. To track the trend for these four quarters, use the indexes to deseasonalize the sales data. 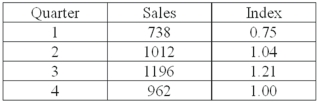 What is the deseasonalized sales value for quarter 3?
Correct Answer:

Verified
Correct Answer:
Verified
Q2: Why are long-range predictions considered essential to
Q5: For the third quarter,the sales are 1,000
Q5: In a linear trend equation, which variable
Q6: The forecast for the third quarter is
Q8: The preferred method used to smooth the
Q8: Product sales since 1999 are: <img src="https://d2lvgg3v3hfg70.cloudfront.net/TB2537/.jpg"
Q9: The following table shows the sales for
Q11: In a time series, high sales in
Q56: In a time series,economic periods of prosperity
Q63: The forecast for the third quarter is