Multiple Choice
A random sample of 30 executives from companies with assets over $1 million was selected and asked for their annual income and level of education. The ANOVA comparing the average income among three levels of education rejected the null hypothesis. The mean square error (MSE) was 243.7. The following table summarized the results: 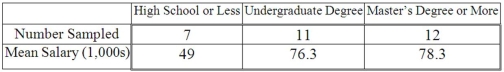 Based on the comparison between the mean annual incomes for executives with undergraduate and master's degrees or more, ________________.
A) a confidence interval shows that the mean annual incomes are not significantly different
B) the ANOVA results show that the mean annual incomes are significantly different
C) a confidence interval shows that the mean annual incomes are significantly different
D) the ANOVA results show that the mean annual incomes are not significantly different
Correct Answer:

Verified
Correct Answer:
Verified
Q88: A random sample of 40 companies with
Q89: Two accounting professors decided to compare the
Q90: A bottle cap manufacturer with four machines
Q91: The test statistic used to compare two
Q92: In a study of protein breakfast bars,
Q94: Two accounting professors decided to compare the
Q95: Below is the information for a completely
Q96: Given the following ANOVA table for three
Q97: When a blocking effect is included in
Q98: A company compared the variance of salaries