Multiple Choice
A random sample of 40 companies with assets over $10 million was surveyed and asked to indicate their industry and annual computer technology expense. The ANOVA comparing the average computer technology expense among three industries rejected the null hypothesis. The mean square error (MSE) was 195. The following table summarized the results: 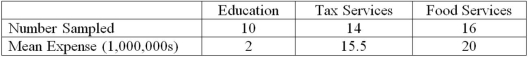 Based on the comparison between the mean annual computer technology expense for companies in the tax service and food service industries, the 95% confidence interval shows an interval of -5.85 to 14.85 for the difference. This result indicates that _______________.
A) there is no significant difference between the two industry technology expenses
B) the interval contains a difference of 20.7
C) companies in the food service industry spend significantly more than companies in the tax service industry
D) companies in the food service industry spend significantly less than companies in the tax service industry
Correct Answer:

Verified
Correct Answer:
Verified
Q1: When testing for differences between treatment means,the
Q84: To test the hypothesis that two population
Q85: Given the following ANOVA table for three
Q86: An ANOVA has three sources of variation.
Q87: Several employees have submitted different methods of
Q89: Two accounting professors decided to compare the
Q90: A bottle cap manufacturer with four machines
Q91: The test statistic used to compare two
Q92: In a study of protein breakfast bars,
Q93: A random sample of 30 executives from