Multiple Choice
The following graph is a ____________. 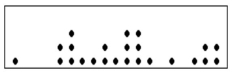
A) Dot plot
B) Stem-and-leaf diagram
C) Box plot
D) Contingency table
Correct Answer:

Verified
Correct Answer:
Verified
Related Questions
Q5: To locate the percentile for a given
Q5: A scatter diagram is used to illustrate
Q7: A dot plot is best applied for
Q8: Community Hospital collected data on the length
Q9: A _ is the best way to
Q11: The 75<sup>th</sup> percentile is referred to as
Q12: For the following data, how many observations
Q13: A dot plot shows _.<br>A) The general
Q15: The following stem-and-leaf display reports the number
Q50: The "box" in a box plot shows