Essay
For the following data, how many observations are in the data? 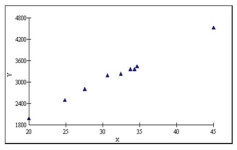
Correct Answer:

Verified
9
Explanation: Simply count th...View Answer
Unlock this answer now
Get Access to more Verified Answers free of charge
Correct Answer:
Verified
9
Explanation: Simply count th...
Explanation: Simply count th...
View Answer
Unlock this answer now
Get Access to more Verified Answers free of charge
Related Questions
Q5: A scatter diagram is used to illustrate
Q7: A dot plot is best applied for
Q8: Community Hospital collected data on the length
Q9: A _ is the best way to
Q10: The following graph is a _. <img
Q11: The 75<sup>th</sup> percentile is referred to as
Q13: A dot plot shows _.<br>A) The general
Q15: The following stem-and-leaf display reports the number
Q16: If the coefficient of skewness is equal
Q17: Given the sample information in the following