Multiple Choice
In the following table, 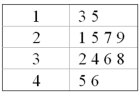
A) There are 16 observations.
B) There are four observations in the second class.
C) There are ten observations less than thirty.
D) There are ten observations greater than thirty.
Correct Answer:

Verified
Correct Answer:
Verified
Related Questions
Q3: What does the interquartile range describe?<br>A)The range
Q6: A dot plot is useful for quickly
Q36: A student scored in the 85<sup>th</sup> percentile
Q45: Quartiles divide a distribution into four equal
Q103: For the following data, what relationship is
Q104: The interquartile range is the distance between
Q108: The 67<sup>th</sup> percentile is:<br>A) the value above
Q109: For the following data, are any of
Q111: The following stem-and-leaf display reports the number
Q113: For the following data, what is the