Essay
A telemarketing firm is monitoring the performance of its employees based on the number of sales per hour. One employee had the following sales for the last 20 hours. Draw a dot plot for the data. 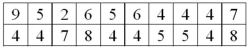
Correct Answer:

Verified
 Explanation: For each value, ...
View Answer
Unlock this answer now
Get Access to more Verified Answers free of charge
Correct Answer:
Verified
View Answer
Unlock this answer now
Get Access to more Verified Answers free of charge
Q19: In a stem-and-leaf display,the leaf represents a
Q31: A telemarketing firm is monitoring the performance
Q33: In a contingency table, we describe the
Q34: A box plot graphically shows the 10<sup>th</sup>
Q35: The following stem-and-leaf display reports the number
Q37: The median of a sample will always
Q39: In a symmetric distribution, is the 99<sup>th</sup>
Q40: A _ clearly shows outliers.
Q41: The following stem-and-leaf display reports the number
Q46: Quartiles divide a distribution into 10 equal