Essay
A telemarketing firm is monitoring the performance of its employees based on the number of sales per hour. One employee had the following sales for the last 19 hours. 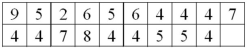 For the distribution of number of sales per hour, what is the interquartile range?
Correct Answer:

Verified
3
Explanation: Sort the data from minimu...View Answer
Unlock this answer now
Get Access to more Verified Answers free of charge
Correct Answer:
Verified
Explanation: Sort the data from minimu...
View Answer
Unlock this answer now
Get Access to more Verified Answers free of charge
Q19: In a stem-and-leaf display,the leaf represents a
Q20: A relationship between two nominal variables is
Q25: A box plot shows the skewness of
Q26: In the following set of data: <img
Q28: In a negatively skewed distribution, the coefficient
Q30: For the following data, find the information
Q33: In a contingency table, we describe the
Q34: A box plot graphically shows the 10<sup>th</sup>
Q35: The following stem-and-leaf display reports the number
Q36: A telemarketing firm is monitoring the performance