Multiple Choice
A student was interested in the cigarette smoking habits of college students and collected data from an unbiased random sample of students. The data is summarized in the following table: 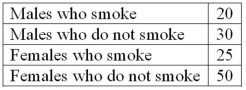 What type of chart best represents the frequency table?
A) Bar chart
B) Box plot
C) Scatter plot
D) Frequency polygon
Correct Answer:

Verified
Correct Answer:
Verified
Q2: Refer to the following breakdown of responses
Q3: Refer to the following breakdown of responses
Q4: Refer to the following breakdown of responses
Q5: In a cumulative frequency distribution, the percent
Q7: Refer to the following breakdown of responses
Q9: In constructing a frequency distribution, the approximate
Q10: If the number of observations is 124,
Q11: A pie chart shows the _.<br>A) Relative
Q67: Refer to the following information from a
Q77: To convert a frequency distribution to a