Multiple Choice
In the graph below, the vertical axis represents average real GDP growth for 65 countries over the period 1960-1995, and the horizontal axis shows the average trade share within these countries. 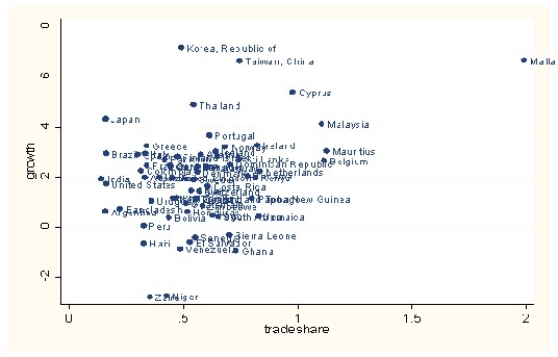 This is an example of
A) cross-sectional data.
B) experimental data.
C) a time series.
D) longitudinal data.
Correct Answer:

Verified
Correct Answer:
Verified
Q7: The reason why economists do not use
Q8: Most economic data are obtained<br>A)through randomized controlled
Q9: Analyzing the behavior of unemployment rates across
Q10: The most frequently used experimental or observational
Q11: In a randomized controlled experiment<br>A)there is a
Q12: Studying inflation in the United States from
Q13: The accompanying graph <img src="https://d2lvgg3v3hfg70.cloudfront.net/TB5979/.jpg" alt="The accompanying
Q14: One of the primary advantages of using
Q16: Analyzing the effect of minimum wage changes
Q17: Panel data<br>A)is also called longitudinal data.<br>B)is the