Multiple Choice
The accompanying graph 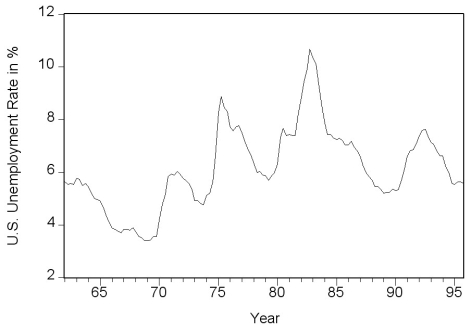 is an example of
A) experimental data.
B) cross-sectional data.
C) a time series.
D) longitudinal data.
Correct Answer:

Verified
Correct Answer:
Verified
Related Questions
Q7: The reason why economists do not use
Q8: Most economic data are obtained<br>A)through randomized controlled
Q9: Analyzing the behavior of unemployment rates across
Q10: The most frequently used experimental or observational
Q11: In a randomized controlled experiment<br>A)there is a
Q12: Studying inflation in the United States from
Q14: One of the primary advantages of using
Q15: In the graph below, the vertical axis
Q16: Analyzing the effect of minimum wage changes
Q17: Panel data<br>A)is also called longitudinal data.<br>B)is the