Multiple Choice
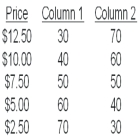
-As the price decreases,the behaviour of the data in Column 2 is most consistent with
A) a supply curve.
B) excess demand.
C) excess supply.
D) a demand curve.
E) an equilibrium.
Correct Answer:

Verified
Correct Answer:
Verified
Related Questions
Q2: Which of the following will NOT cause
Q3: If the price of a good is
Q4: Since 1990,per-capita income in China has risen.In
Q5: When the demand for a good increases,firms
Q6: Suppose that one observes that,when the price
Q7: The demand curve illustrates that consumers purchase<br>A)
Q8: <img src="https://d2lvgg3v3hfg70.cloudfront.net/TB3713/.jpg" alt=" -If column 1
Q9: In 1996,"mad cow" disease caused the European
Q10: Suppose that a market is currently at
Q11: In the mid-1990s,The Wall Street Journal reported