Multiple Choice
The graphs below refer to the market for good X.Firms can produce either good X or good Y,which consumers consider to be a substitute for good X.A decrease in the price of good Y will to lead to the shifts shown by 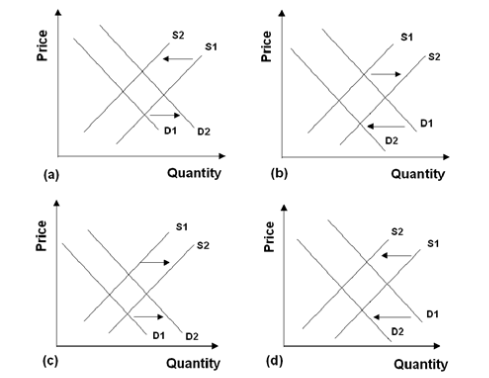
A) Graph (a) .
B) Graph (b) .
C) Graph (c) .
D) Graph (d) .
E) Both Graph (a) and Graph (d) .
Correct Answer:

Verified
Correct Answer:
Verified
Q16: Market Equilibrium<br> <img src="https://d2lvgg3v3hfg70.cloudfront.net/TB3713/.jpg" alt="Market Equilibrium
Q17: <img src="https://d2lvgg3v3hfg70.cloudfront.net/TB3713/.jpg" alt=" -If column 1
Q18: If both buyers and sellers expect the
Q19: <img src="https://d2lvgg3v3hfg70.cloudfront.net/TB3713/.jpg" alt=" -Assume that the
Q20: Season tickets to the Toronto Maple Leafs
Q22: <img src="https://d2lvgg3v3hfg70.cloudfront.net/TB3713/.jpg" alt=" -If column 1
Q23: <img src="https://d2lvgg3v3hfg70.cloudfront.net/TB3713/.jpg" alt=" -For the quantity
Q24: One of the assumptions of the supply
Q25: Refer to the graphs below.A recent report
Q26: A graph with price on the vertical