Multiple Choice
Refer to the graphs below.A recent report circulated among consumers indicated that 50 additional intensive-care patients die for every 1,000 who are managed with a heart device,known as the right heart catheter,and subsequent Health Canada action to limit distribution of the catheter would most likely cause the shifts shown by 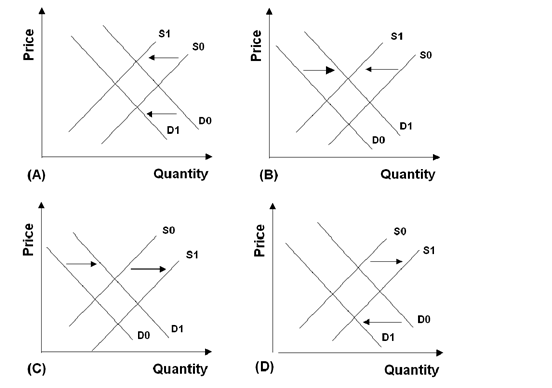
A) Graph (A) .
B) Graph (B) .
C) Graph (C) .
D) Graph (D) .
E) Both Graph (C) and Graph (D) .
Correct Answer:

Verified
Correct Answer:
Verified
Q20: Season tickets to the Toronto Maple Leafs
Q21: The graphs below refer to the market
Q22: <img src="https://d2lvgg3v3hfg70.cloudfront.net/TB3713/.jpg" alt=" -If column 1
Q23: <img src="https://d2lvgg3v3hfg70.cloudfront.net/TB3713/.jpg" alt=" -For the quantity
Q24: One of the assumptions of the supply
Q26: A graph with price on the vertical
Q27: When economists refer to small sellers in
Q28: Suppose that the price of gasoline increases.One
Q29: <img src="https://d2lvgg3v3hfg70.cloudfront.net/TB3713/.jpg" alt=" -If supply shifts
Q30: If the market for coffee has excess