Multiple Choice
What is this figure demonstrating?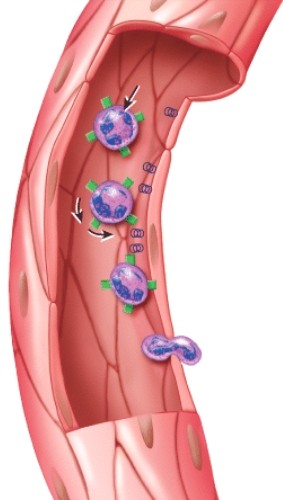
A) Erythropoiesis
B) RBC differentiation
C) Emigration
D) Clot formation
E) Clot retraction
Correct Answer:

Verified
Correct Answer:
Verified
Related Questions
Q73: The gas [dropdown 1] is said to
Q74: Which of the following cells is NOT
Q75: A high count of which of the
Q76: Deep vein thromboses,blood clots that build up
Q77: Erythropoiesis may be stimulated by<br>A)pulmonary disease that
Q78: Which letter in the diagram indicates the
Q79: The intrinsic and extrinsic pathways of blood
Q80: Anemia is defined as<br>A)a condition where blood
Q81: Towards the end of erythropoiesis in the
Q82: A megakaryoblast will develop into<br>A)a red blood