Multiple Choice
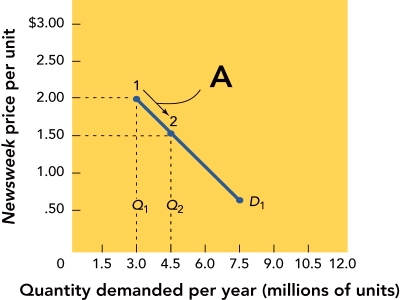 Figure 13-5A
-Figure 13-5A above shows that when the price moves from $2.00 to $1.50 per unit along the demand curve D1,the quantity demanded
A) increases from 3.0 to 4.5 million units per year.
B) decreases from 4.5 to 3.0 million units per year.
C) stays the same.
D) increases from 3.0 to 7.5 million units per year.
E) decreases from 7.5 to 3.0 million units per year.
Correct Answer:

Verified
Correct Answer:
Verified
Q21: a snack vending machine,consumers can choose one
Q22: Market analysts for a large cereal company
Q24: Explain the three forms of price elasticity
Q28: study of four supermarket chains found the
Q29: percentage change in quantity demanded relative to
Q51: Figure 13-2 above represents the six steps
Q79: Campbell Soup spent seven years and $55
Q104: Which pricing constraint does the following statement
Q143: Washburn Guitars markets its guitars to four
Q242: Price elasticity of demand measures how sensitive