Multiple Choice
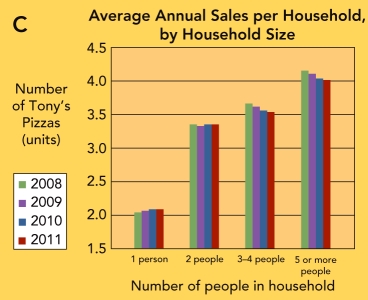 Figure 8-6C: Average Annual Sales per Household of Tony's Pizza, by Household Size
-Figure 8-6C above shows that
A) Tony's Pizza sales to households with 5 or more people increased over the period 2008 to 2011.
B) households with 5 or more people bought the least amount of Tony's Pizza over the period 2008 to 2011.
C) from 2008 to 2011, as single people married and became two person households, the increase in sales of Tony's Pizza was greater than the expected 200% change.
D) Tony's Pizza sales to households with 2 people have remained relatively steady from 2008 to 2011.
E) the changes from year to year are really not significant since overall sales of Tony's Pizza have continued to increase.
Correct Answer:

Verified
Correct Answer:
Verified
Q76: <img src="https://d2lvgg3v3hfg70.cloudfront.net/TB2495/.jpg" alt=" Marketing Research Method
Q77: type of market is a food company
Q78: picture or verbal description of a product
Q79: <img src="https://d2lvgg3v3hfg70.cloudfront.net/TB2495/.jpg" alt=" Figure 8-A -the
Q81: survey by the Economic Research Service of
Q83: Gerst,who manages the Carmex social media properties,says,"For
Q84: 2007 _ contains data on the number
Q85: Research objectives are _.<br>A) goals conjectures regarding
Q232: Filmmakers want movie titles that use the
Q309: _ involves starting with the last known