Multiple Choice
The graph below represents a wave function ψ(x) for a particle confined to −2.00 m ≤ x ≤ +2.00 m.The value of the normalization constant A may be 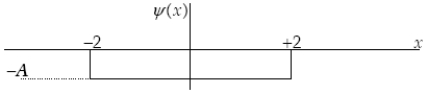
A)  .
.
B)  .
.
C)  .
.
D)  .
.
E) either  or
or  .
.
Correct Answer:

Verified
Correct Answer:
Verified
Related Questions
Q6: The fact that we can only calculate
Q9: Find the kinetic energy (in terms of
Q21: A particle is in the first excited
Q23: If the interaction of a particle with
Q23: The wave function for a particle in
Q27: The graph below shows the value of
Q28: When U(x)is infinitely large elsewhere,the wave function
Q29: The wave function for a particle in
Q31: The wave function for a particle confined
Q32: A particle in a finite potential well