Multiple Choice
Use the figure for the question(s) below. 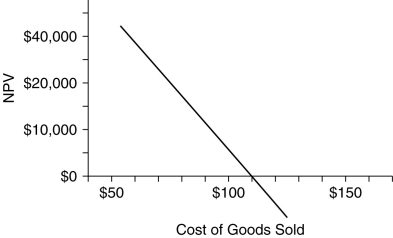
-The graph above shows the break-even analysis for the cost of making a certain good. Based on this chart, which of the following is true?
A) The project should not be undertaken if the predicted cost of goods sold is less than $110.
B) The net present value (NPV) of the project increases with increased cost of goods sold.
C) If the good costs $110 to make, the net present value (NPV) of the project will be zero.
D) The net present value (NPV) of the project will be positive if the cost of goods sold is greater than $110.
Correct Answer:

Verified
Correct Answer:
Verified
Q16: Use the table for the question(s)below. <img
Q17: Use the information for the question(s)below.<br>The Sisyphean
Q18: Use the figure for the question(s)below. <img
Q20: Which of the following best explains why
Q22: Use the information for the question(s)below.<br>Epiphany Industries
Q23: Use the table for the question(s)below. <img
Q24: An exploration of the effect of changing
Q25: Use the table for the question(s)below. <img
Q26: Use the figure for the question(s)below. <img
Q40: To evaluate a capital budgeting decision, it