Essay
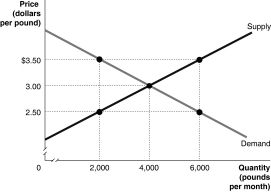
The graph below represents the market for walnuts. Identify the values of the marginal benefit and the marginal cost at the output levels of 2000 pounds, 4000 pounds and 6000 pounds. At each of these output levels, state whether output is inefficiently high, inefficiently low, or economically efficient.
Correct Answer:

Verified
Output level = 2000 lbs: marginal benefi...View Answer
Unlock this answer now
Get Access to more Verified Answers free of charge
Correct Answer:
Verified
View Answer
Unlock this answer now
Get Access to more Verified Answers free of charge
Q12: Figure 5.1 <img src="https://d2lvgg3v3hfg70.cloudfront.net/TB1015/.jpg" alt="Figure 5.1
Q27: Figure 5.5 <img src="https://d2lvgg3v3hfg70.cloudfront.net/TB1015/.jpg" alt="Figure 5.5
Q107: Table 5.5 <img src="https://d2lvgg3v3hfg70.cloudfront.net/TB1015/.jpg" alt="Table 5.5
Q115: Which term refers to a legally established
Q129: Figure 5.7 <img src="https://d2lvgg3v3hfg70.cloudfront.net/TB1015/.jpg" alt="Figure 5.7
Q135: Economic efficiency is a market outcome in
Q159: The graph below represents the market for
Q163: <img src="https://d2lvgg3v3hfg70.cloudfront.net/TB4183/.jpg" alt=" -Refer to Figure
Q184: Figure 5.1 <img src="https://d2lvgg3v3hfg70.cloudfront.net/TB1015/.jpg" alt="Figure 5.1
Q351: Lucinda buys a new GPS system for