Essay
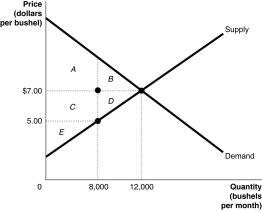
The graph below represents the market for lychee nuts. The equilibrium price is $7.00 per bushel, but the market price is $5.00 per bushel. Identify the areas representing consumer surplus, producer surplus, and deadweight loss at the equilibrium price of $7.00 and at the market price of $5.00.
Correct Answer:

Verified
At the equilibrium price of $7.00:
Consu...View Answer
Unlock this answer now
Get Access to more Verified Answers free of charge
Correct Answer:
Verified
Consu...
View Answer
Unlock this answer now
Get Access to more Verified Answers free of charge
Q12: Figure 5.1 <img src="https://d2lvgg3v3hfg70.cloudfront.net/TB1015/.jpg" alt="Figure 5.1
Q27: Figure 5.5 <img src="https://d2lvgg3v3hfg70.cloudfront.net/TB1015/.jpg" alt="Figure 5.5
Q72: Figure 5.7 <img src="https://d2lvgg3v3hfg70.cloudfront.net/TB1015/.jpg" alt="Figure 5.7
Q115: Which term refers to a legally established
Q129: Figure 5.7 <img src="https://d2lvgg3v3hfg70.cloudfront.net/TB1015/.jpg" alt="Figure 5.7
Q135: Economic efficiency is a market outcome in
Q160: The graph below represents the market for
Q163: <img src="https://d2lvgg3v3hfg70.cloudfront.net/TB4183/.jpg" alt=" -Refer to Figure
Q184: Figure 5.1 <img src="https://d2lvgg3v3hfg70.cloudfront.net/TB1015/.jpg" alt="Figure 5.1
Q351: Lucinda buys a new GPS system for