Figure 10.6 -Refer to Figure 10.6.Suppose Dell Finds the Relationship Between the Relationship
Multiple Choice
Figure 10.6 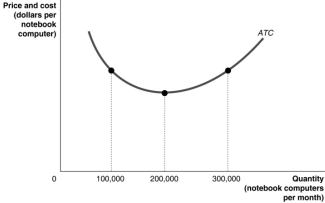
-Refer to Figure 10.6.Suppose Dell finds the relationship between the average total cost of producing notebook computers and the quantity of notebook computers produced is as shown by Figure 10-6.Dell will maximise profits if it produces ________ notebook computers per month.
A) 100 000
B) 200 000
C) 300 000
D) Not enough information is given to determine the profit-maximising quantity.
Correct Answer:

Verified
Correct Answer:
Verified
Q10: Long-run equilibrium under monopolistic competition is similar
Q17: Figure 10.3 <img src="https://d2lvgg3v3hfg70.cloudfront.net/TB1015/.jpg" alt="Figure 10.3
Q18: Figure 10.12 <img src="https://d2lvgg3v3hfg70.cloudfront.net/TB1015/.jpg" alt="Figure 10.12
Q19: The table below shows the demand and
Q20: Figure 10.4 <img src="https://d2lvgg3v3hfg70.cloudfront.net/TB1015/.jpg" alt="Figure 10.4
Q22: Figure 10.8 <img src="https://d2lvgg3v3hfg70.cloudfront.net/TB1015/.jpg" alt="Figure 10.8
Q24: Table 10.1 <img src="https://d2lvgg3v3hfg70.cloudfront.net/TB1015/.jpg" alt="Table 10.1
Q25: Figure 10.4 <img src="https://d2lvgg3v3hfg70.cloudfront.net/TB1015/.jpg" alt="Figure 10.4
Q200: What is the difference between zero accounting
Q210: Firms in monopolistic competition compete by selling