Multiple Choice
Figure 10.8 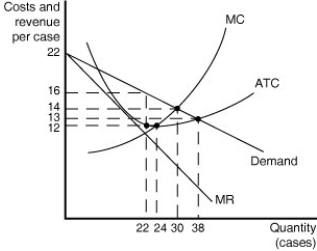 Figure 10.8 shows cost and demand curves for a monopolistically competitive producer of iced tea.
-Refer to Figure 10.8.Based on the diagram, one can conclude that
A) some existing firms will exit the market.
B) new firms will enter the market.
C) the industry is in long-run equilibrium.
D) firms achieve productive efficiency.
Correct Answer:

Verified
Correct Answer:
Verified
Q10: Long-run equilibrium under monopolistic competition is similar
Q17: Figure 10.3 <img src="https://d2lvgg3v3hfg70.cloudfront.net/TB1015/.jpg" alt="Figure 10.3
Q18: Figure 10.12 <img src="https://d2lvgg3v3hfg70.cloudfront.net/TB1015/.jpg" alt="Figure 10.12
Q19: The table below shows the demand and
Q20: Figure 10.4 <img src="https://d2lvgg3v3hfg70.cloudfront.net/TB1015/.jpg" alt="Figure 10.4
Q21: Figure 10.6 <img src="https://d2lvgg3v3hfg70.cloudfront.net/TB1015/.jpg" alt="Figure 10.6
Q24: Table 10.1 <img src="https://d2lvgg3v3hfg70.cloudfront.net/TB1015/.jpg" alt="Table 10.1
Q25: Figure 10.4 <img src="https://d2lvgg3v3hfg70.cloudfront.net/TB1015/.jpg" alt="Figure 10.4
Q200: What is the difference between zero accounting
Q263: For a downward-sloping demand curve, marginal revenue