Multiple Choice
The saving schedule shown in the diagram below would shift downward if,all else equal: 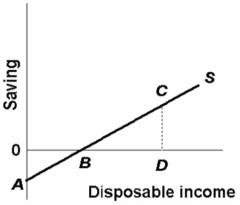
A) the average propensity to save increased at each income level.
B) the marginal propensity to save rose at each income level.
C) consumer wealth rose rapidly because of a significant increase in stock market prices.
D) the real interest rate increased.
Correct Answer:

Verified
Correct Answer:
Verified
Q6: The multiplier effect:<br>A)reduces the MPC.<br>B)magnifies small changes
Q17: The investment-demand curve suggests:<br>A)that the amount invested
Q44: The investment-demand curve will shift to the
Q53: The APC can be defined as the
Q60: Assume there are no prospective investment projects
Q61: <img src="https://d2lvgg3v3hfg70.cloudfront.net/TB2474/.jpg" alt=" -Refer to the
Q64: Assume that for the entire business sector
Q68: <img src="https://d2lvgg3v3hfg70.cloudfront.net/TB2474/.jpg" alt=" -The above schedule
Q106: The relationship between consumption and disposable income
Q148: If the marginal propensity to consume is