Multiple Choice
Assume that for the entire business sector of a private closed economy there is $0 worth of investment projects which will yield an expected rate of return of 25 percent or more.But there are $15 worth of investments which will yield an expected rate of return of 20-25 percent;another $15 with an expected rate of return of 15-20 percent;and similarly an additional $15 of investment projects in each successive rate of return range down to and including the 0-5 percent range. 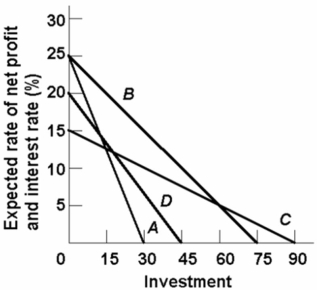
Which of the lines on the above diagram represents these data?
A) A
B) B
C) C
D) D
Correct Answer:

Verified
Correct Answer:
Verified
Q6: The multiplier effect:<br>A)reduces the MPC.<br>B)magnifies small changes
Q17: The investment-demand curve suggests:<br>A)that the amount invested
Q44: The investment-demand curve will shift to the
Q53: The APC can be defined as the
Q60: Assume there are no prospective investment projects
Q61: <img src="https://d2lvgg3v3hfg70.cloudfront.net/TB2474/.jpg" alt=" -Refer to the
Q65: The saving schedule shown in the diagram
Q68: <img src="https://d2lvgg3v3hfg70.cloudfront.net/TB2474/.jpg" alt=" -The above schedule
Q132: The investment-demand curve will shift to the
Q148: If the marginal propensity to consume is