Multiple Choice
The accompanying chart shows the number of books written by each author in a collection of cookbooks. What type of data is being represented? 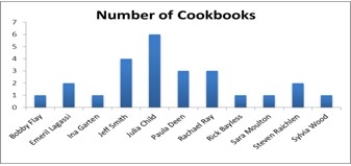
A) Quantitative, ordinal
B) Quantitative, ratio
C) Qualitative, nominal
D) Qualitative, ordinal
Correct Answer:

Verified
Correct Answer:
Verified
Related Questions
Q6: In the following pie chart representing a
Q7: The following table shows the percentage of
Q8: The following table shows analyst sentiment ratings
Q9: A scatterplot is a graphical tool that
Q10: A city in California spent $6 million
Q12: When summarizing quantitative data it is always
Q13: When constructing a scatterplot for two quantitative
Q14: The organization of the Girl Sprouts has
Q15: A survey conducted by CBS news asked
Q16: Construct a stem-and-leaf diagram with the following