Multiple Choice
In the following pie chart representing a collection of cookbooks, which author has more titles? 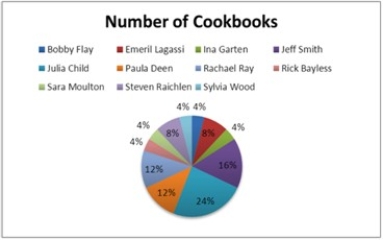
A) Jeff Smith
B) Julia Child
C) Rachael Ray
D) Paula Deen
Correct Answer:

Verified
Correct Answer:
Verified
Related Questions
Q1: The accompanying relative frequency distribution represents the
Q2: The accompanying chart shows the numbers of
Q3: <img src="https://d2lvgg3v3hfg70.cloudfront.net/TB6618/.jpg" alt=" Using a scatterplot
Q4: Construct a stem-and-leaf diagram for the following
Q5: Thirty students at Eastside High School took
Q7: The following table shows the percentage of
Q8: The following table shows analyst sentiment ratings
Q9: A scatterplot is a graphical tool that
Q10: A city in California spent $6 million
Q11: The accompanying chart shows the number of