Multiple Choice
Automobiles traveling on a road with a posted speed limit of 65 miles per hour are checked for speed by a state police radar system. The following table is a frequency distribution of speeds. 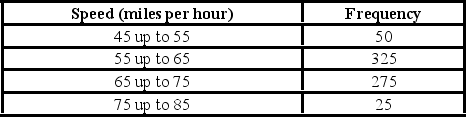 How many of the cars traveled less than 75 miles per hour?
A) 275
B) 325
C) 650
D) 675
Correct Answer:

Verified
Correct Answer:
Verified
Q101: In the accompanying stem-and-leaf diagram, the values
Q102: What type of relationship is indicated in
Q103: Consider the following frequency distribution. <img src="https://d2lvgg3v3hfg70.cloudfront.net/TB6618/.jpg"
Q104: The following data represent scores on a
Q105: The dividend yields of the stocks in
Q107: The relative frequency of a category is
Q108: For qualitative data, a frequency distribution groups
Q109: The shape of most data distributions can
Q110: A pie chart is a segmented circle
Q111: Each month the Bureau of Labor Statistics