Essay
Each month the Bureau of Labor Statistics reports the number of people (in thousands) employed in the United States by age. The accompanying frequency distribution shows the results for August. 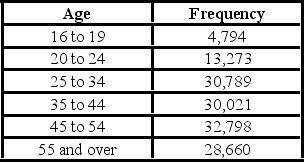 a. Construct a relative frequency distribution. What proportion of workers is between 20 and 24 years old?
B) Construct a cumulative relative frequency distribution. What proportion of workers is younger than 35 years old?
C) Construct a relative frequency histogram.
Correct Answer:

Verified
a. 0.095.
...View Answer
Unlock this answer now
Get Access to more Verified Answers free of charge
Correct Answer:
Verified
...
View Answer
Unlock this answer now
Get Access to more Verified Answers free of charge
Q106: Automobiles traveling on a road with a
Q107: The relative frequency of a category is
Q108: For qualitative data, a frequency distribution groups
Q109: The shape of most data distributions can
Q110: A pie chart is a segmented circle
Q112: Automobiles traveling on a road with a
Q113: A polygon connects a series of neighboring
Q114: The statistics professor has kept attendance records
Q115: An auto parts chain asked customers to
Q116: Use the following data to construct a