Multiple Choice
The statistics professor has kept attendance records and recorded the number of absent students per class. The recorded data is displayed in the following bar chart with the frequency of each number of absent students shown above the bars. 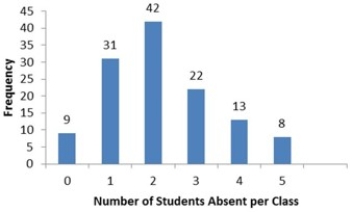 How many statistics classes had three or more students absent?
A) 8
B) 13
C) 22
D) 43
Correct Answer:

Verified
Correct Answer:
Verified
Q109: The shape of most data distributions can
Q110: A pie chart is a segmented circle
Q111: Each month the Bureau of Labor Statistics
Q112: Automobiles traveling on a road with a
Q113: A polygon connects a series of neighboring
Q115: An auto parts chain asked customers to
Q116: Use the following data to construct a
Q117: The following data represent scores on a
Q118: The organization of the Girl Sprouts has
Q119: The following histogram represents the number of