Essay
The following is return data for a retail sector ETF and energy sector ETF for the years, Year 1 to Year 5. 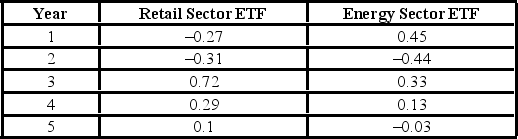 (See the Excel Data File.)
A) What is the arithmetic mean return for each ETF?
B) What is the geometric mean return for each ETF?
C) What is the sample standard deviation for each ETF? Which ETF was riskier over this time period?
D) Given a risk free rate of 5%, what is the Sharpe Ratio for each ETF? Which investment had a better return per unit of risk over this time period?
Correct Answer:

Verified
a) Arithmetic Mean Retail =AVERAGE() = 0...View Answer
Unlock this answer now
Get Access to more Verified Answers free of charge
Correct Answer:
Verified
View Answer
Unlock this answer now
Get Access to more Verified Answers free of charge
Q9: Amounts spent by a sample of 200
Q10: In quality control settings, businesses prefer a
Q11: The arithmetic mean is the middle value
Q12: The sample data below shows the number
Q13: Which of the following is the most
Q15: Yearly returns (rounded to the nearest percent)
Q16: Which of the following is not true
Q17: When working with grouped data, the class
Q18: A portfolio's annual total returns (in percent)
Q19: Consider a population with data values of