Multiple Choice
The following frequency distribution shows the monthly stock returns for Home Depot for the years 2003 through 2007. 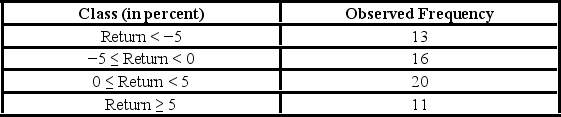 Over the time period, the following summary statistics are provided: Mean = 0.31%, Standard deviation = 6.49%, Skewness = 0.15, and Kurtosis = 0.38. For the goodness-of-fit test for normality, the null and alternative hypothesis are ________.
A) H0: The returns follow a normal distribution with mean 6.49% and standard deviation 0.31%; HA: The returns do not follow a normal distribution with mean 6.49% and standard deviation 0.31%
B) H0: The returns do not follow a normal distribution with mean 6.49% and standard deviation 0.31%; HA: The returns follow a normal distribution with mean 6.49% and standard deviation 0.31%
C) H0: The returns follow a normal distribution with mean 0.31% and standard deviation 6.49%; HA: The returns do not follow a normal distribution with mean 0.31% and standard deviation 6.49%
D) H0: The returns do not follow a normal distribution with mean 0.31% and standard deviation 6.49%; HA: The returns follow a normal distribution with mean 0.31% and standard deviation 6.49%
Correct Answer:

Verified
Correct Answer:
Verified
Q68: The following table shows the distribution of
Q69: A university has six colleges and takes
Q70: The heights (in cm) for a random
Q71: In the following table, individuals are cross-classified
Q72: A card-dealing machine deals spades (1), hearts
Q74: Suppose you want to determine if gender
Q75: Suppose you want to determine if the
Q76: Suppose Bank of America would like to
Q77: In the following table, individuals are cross-classified
Q78: The following table shows the distribution of