Multiple Choice
The following frequency distribution shows the monthly stock returns for Home Depot for the years 2003 through 2007. 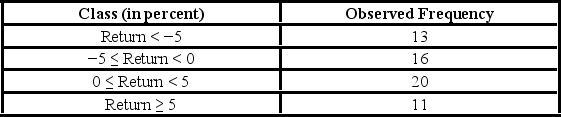 Over the time period, the following summary statistics are provided: Mean = 0.31%, Standard deviation = 6.49%, Skewness = 0.15, and Kurtosis = 0.38. The probability that the return is less than −5% if the return is normally distributed is ________.
A) 0.2061
B) 0.2740
C) 0.2841
D) 0.2358
Correct Answer:

Verified
Correct Answer:
Verified
Q61: The following frequency distribution shows the monthly
Q62: For the goodness-of-fit test for normality to
Q63: In the following table, individuals are cross-classified
Q64: The heights (in cm) for a random
Q65: The heights (in cm) for a random
Q67: A university has six colleges and takes
Q68: The following table shows the distribution of
Q69: A university has six colleges and takes
Q70: The heights (in cm) for a random
Q71: In the following table, individuals are cross-classified