Multiple Choice
The following frequency distribution shows the monthly stock returns for Home Depot for the years 2003 through 2007. 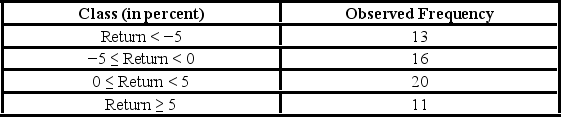 Over the time period, the following summary statistics are provided: Mean = 0.31%, Standard deviation = 6.49%, Skewness = 0.15, and Kurtosis = 0.38. Using the Jarque-Bera test for normality, the p-value is ________.
A) less than 0.01
B) between 0.01 and 0.05
C) between 0.05 and 0.10
D) greater than 0.10
Correct Answer:

Verified
Correct Answer:
Verified
Q56: The heights (in cm) for a random
Q57: In the following table, likely voters' preferences
Q58: For a multinomial experiment with k categories,
Q59: The heights (in cm) for a random
Q60: The following table shows the distribution of
Q62: For the goodness-of-fit test for normality to
Q63: In the following table, individuals are cross-classified
Q64: The heights (in cm) for a random
Q65: The heights (in cm) for a random
Q66: The following frequency distribution shows the monthly