Multiple Choice
The following frequency distribution shows the monthly stock returns for Home Depot for the years 2003 through 2007. 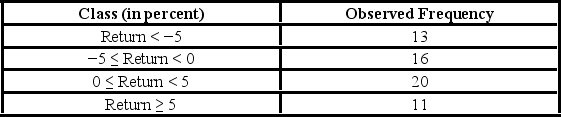 Over the time period, the following summary statistics are provided: Mean = 0.31%, Standard deviation = 6.49%, Skewness = 0.15, and Kurtosis = 0.38. The test statistic for the Jarque-Bera test for normality is ________.
A) 0.59
B) 0.95
C) 0.43
D) 0.34
Correct Answer:

Verified
Correct Answer:
Verified
Q31: Suppose Bank of America would like to
Q32: The following table shows the cross-classification of
Q33: In the following table, likely voters' preferences
Q34: A goodness-of-fit test analyzes for two qualitative
Q35: When applying the goodness-of-fit test for normality,
Q37: Packaged candies have three different types of
Q38: A manufacturer of flash drives for data
Q39: The following table shows the distribution of
Q40: The heights (in cm) for a random
Q41: A researcher wants to determine if the