Multiple Choice
The following table shows the annual revenues (in millions of dollars) of a pharmaceutical company over the period 1990-2011. 
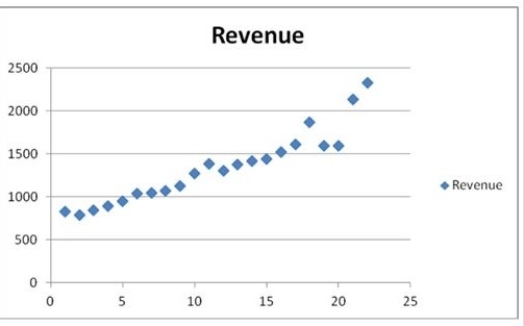 The scatterplot indicates that the annual revenues have an increasing trend. Linear, exponential, quadratic, and cubic models were fit to the data starting with t = 1, and the following output was generated.
  Using the linear trend equation, one can say that the predicted revenue increases by ________.
A) $642,792,000 a year
B) $604,960,000 a year
C) $60,496,000 a year
D) $6,049,600 a year
Correct Answer:

Verified
Correct Answer:
Verified
Q98: If T denotes the number of observations,
Q99: The following table includes the information about
Q100: Based on quarterly data collected over the
Q101: The following table shows the annual revenues
Q102: The following table includes the information about
Q104: Which of the following is an example
Q105: Which of the following is a smoothing
Q106: The following table shows the annual revenues
Q107: The centered moving average (CMA), applied in
Q108: Which of the following components does not