Multiple Choice
The following table shows the annual revenues (in millions of dollars) of a pharmaceutical company over the period 1990-2011. 
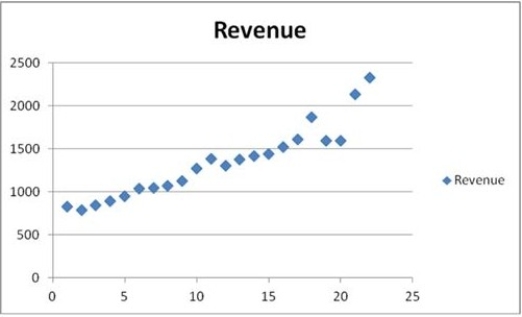 The scatterplot indicates that the annual revenues have an increasing trend. Linear, exponential, quadratic, and cubic models were fit to the data starting with t = 1, and the following output was generated.
  Which of the following is the revenue forecast for 2013 found by the trend regression equation with the best fit?
A) About 2 billion and 337 million dollars
B) About 2 billion and 95 million dollars
C) About 2 billion and 248 million dollars
D) About 2 billion and 290 million dollars
Correct Answer:

Verified
Correct Answer:
Verified
Q101: The following table shows the annual revenues
Q102: The following table includes the information about
Q103: The following table shows the annual revenues
Q104: Which of the following is an example
Q105: Which of the following is a smoothing
Q107: The centered moving average (CMA), applied in
Q108: Which of the following components does not
Q109: Which of the following is true of
Q110: In the exponential smoothing formula for updating
Q111: The following table shows the annual revenues