Short Answer
The following table shows the annual revenues (in millions of dollars) of a pharmaceutical company over the period 1990-2011. 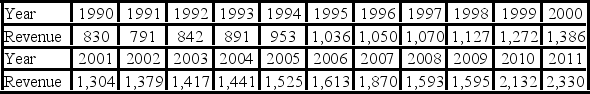 The autoregressive models of order 1 and 2, yt = β0 + β1yt - 1 + εt, and yt = β0 + β1yt - 1 + β2yt - 2 + εt, were applied on the time series to make revenue forecasts. The relevant parts of Excel regression outputs are given below.
Model AR(1): 
 Model AR(2):
 Compare Excel outputs for AR(1) and AR(2) and choose the forecasting model that seems to be better.
Correct Answer:

Verified
Correct Answer:
Verified
Q106: The following table shows the annual revenues
Q107: The centered moving average (CMA), applied in
Q108: Which of the following components does not
Q109: Which of the following is true of
Q110: In the exponential smoothing formula for updating
Q112: The moving average method is one of
Q113: In the decomposition method, which of the
Q114: Which of the following factors refers to
Q115: Which of the following is a centered
Q116: The following table includes the information about