Multiple Choice
The graph in the figure shows the velocity of a particle as it travels along the x-axis. What is the magnitude of the average acceleration of the particle between t = 1.0 s and t = 4.0 s? 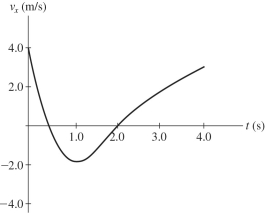
A) 0.33 m/s2
B) 1.7 m/s2
C) 2.0 m/s2
D) 2.5 m/s2
E) 3.0 m/s2
Correct Answer:

Verified
Correct Answer:
Verified
Related Questions
Q39: A motorist travels 160 km at 80
Q49: An object moves 15.0 m north and
Q57: A car is traveling with a constant
Q76: The figure shows a graph of the
Q80: A ball is thrown upward at a
Q88: A motorist travels for 3.0 h at
Q117: A 10-kg rock and a 20-kg rock
Q129: To determine the height of a bridge
Q137: Suppose that an object is moving with
Q292: A ball is thrown straight up with