Short Answer
The figure shows a graph of the velocity of an object as a function of time. What is the average acceleration of the object over the following time intervals?
(a) From t = 0 s to t = 5.0 s
(b) From t = 0 s to t = 8.0 s 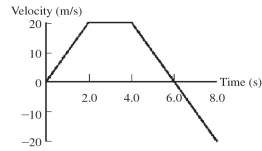
Correct Answer:

Verified
(a) 2.0 m/...View Answer
Unlock this answer now
Get Access to more Verified Answers free of charge
Correct Answer:
Verified
(a) 2.0 m/...
View Answer
Unlock this answer now
Get Access to more Verified Answers free of charge
Related Questions
Q39: A motorist travels 160 km at 80
Q72: The graph in the figure shows the
Q78: The graph in the figure shows the
Q79: A soccer ball is released from rest
Q80: A ball is thrown upward at a
Q80: The graph in the figure shows the
Q81: The captain orders his starship to accelerate
Q88: A motorist travels for 3.0 h at
Q129: To determine the height of a bridge
Q292: A ball is thrown straight up with