Multiple Choice
The figure shows a pV diagram for 0.0061 mol of ideal gas that undergoes the process 1 → 2 → 3. What is the pressure p2? (R = 8.31 J/mol ∙ K) 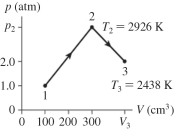
A) 4.9 atm
B) 4.9 × 10⁵ atm
C) 15 atm
D) 1.5 × 10⁶ atm
Correct Answer:

Verified
Correct Answer:
Verified
Related Questions
Q13: On a cold day,a piece of metal
Q15: A person tries to heat up her
Q27: Two metal rods,one silver and the other
Q39: A jogger is running outdoors on a
Q40: A person is walking outdoors on a
Q64: A heat-conducting rod that is wrapped in
Q68: A fixed container holds oxygen and helium
Q82: The rms speed of a certain sample
Q168: The figure shows a pV diagram for
Q171: If you add 700 kJ of