Multiple Choice
The process shown in the pV diagram in the figure is an 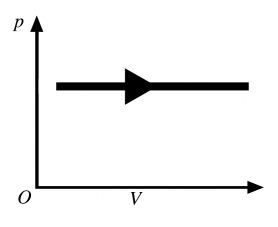
A) adiabatic expansion.
B) isothermal expansion.
C) isochoric expansion.
D) isobaric expansion.
E) isochoric compression.
Correct Answer:

Verified
Correct Answer:
Verified
Related Questions
Q35: The temperature of an ideal gas in
Q36: In an isochoric process,the internal (thermal)energy of
Q37: The figure shows a pV diagram for
Q38: The pV diagram shown is for 7.50
Q39: An expansion process on an ideal diatomic
Q41: A quantity of ideal gas requires 800
Q42: An ideal gas initially at 300 K
Q43: During an adiabatic process,an ideal gas does
Q44: An ideal monatomic gas cools from 455.0
Q45: How much work is done by 3.00