Multiple Choice
The figure shows the graph of the position x as a function of time for an object moving in the straight line (the x-axis) .Which of the following graphs best describes the velocity along the x-axis as a function of time for this object? 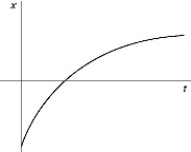
A) 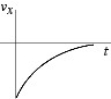
B) 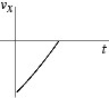
C) 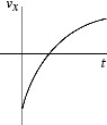
D) 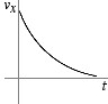
E) 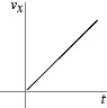
Correct Answer:

Verified
Correct Answer:
Verified
Related Questions
Q2: The motion of a particle is described
Q3: A cat runs along a straight line
Q4: The figure shows a graph of the
Q5: The figure shows the position of an
Q6: The figure shows the position of an
Q8: As part of an exercise program,a woman
Q9: The motions of a car and a
Q11: The figure represents the position of a
Q12: An object starts its motion with a
Q35: If the fastest you can safely drive