Multiple Choice
An object starts its motion with a constant velocity of 2.0 m/s toward the east.After 3.0 s,the object stops for 1.0 s.The object then moves toward the west a distance of 2.0 m in 3.0 s.The object continues traveling in the same direction,but increases its speed by 1.0 m/s for the next 2.0 s.Which graph below could represent the motion of this object?
A) 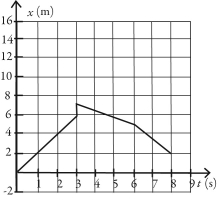
B) 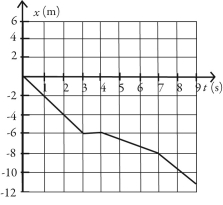
C) 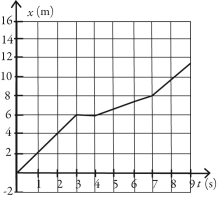
D) 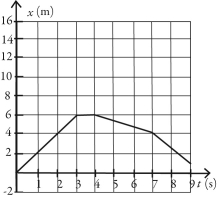
Correct Answer:

Verified
Correct Answer:
Verified
Q5: The figure shows the position of an
Q6: The figure shows the position of an
Q7: The figure shows the graph of the
Q8: As part of an exercise program,a woman
Q9: The motions of a car and a
Q11: The figure represents the position of a
Q12: Arthur and Betty start walking toward each
Q13: The graph in the figure shows the
Q31: The velocity of an object is given
Q35: If the fastest you can safely drive