Short Answer
The graph in the figure represents the velocity of a particle as it travels along the x-axis.What is the average acceleration of the particle between t = 2.0 s and t = 4.0 s? 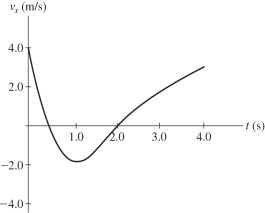
Correct Answer:

Verified
Correct Answer:
Verified
Related Questions
Q11: A light-year is the distance that light
Q29: A cart starts from rest and accelerates
Q49: The graph in the figure shows the
Q51: A ball is thrown straight up with
Q56: A 10-kg rock and a 20-kg rock
Q57: A car is traveling with a constant
Q63: Suppose that a car traveling to the
Q76: A ball is thrown straight up,reaches a
Q100: An airplane starts from rest and accelerates
Q115: If you are driving 72 km/h along