Multiple Choice
The graph in the figure shows the position of a particle as it travels along the x-axis.What is the magnitude of the average speed of the particle between t = 1.0 s and t = 4.0 s? 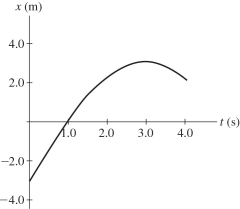
A) 1.0 m/s
B) 1.3 m/s
C) 0.67 m/s
D) 0.50 m/s
E) 0.25 m/s
Correct Answer:

Verified
Correct Answer:
Verified
Related Questions
Q11: A light-year is the distance that light
Q31: A certain test car can go from
Q45: From the edge of a roof top
Q51: A ball is thrown straight up with
Q54: The graph in the figure represents the
Q76: A ball is thrown straight up,reaches a
Q79: A soccer ball is released from rest
Q86: If the velocity versus time graph of
Q100: An airplane starts from rest and accelerates
Q402: If the velocity of an object is