Multiple Choice
The figure shows a pV diagram for an ideal gas that is carried around a cyclic process.How much work is done on the gas in one cycle if p0 = and L? (1.00 atm = 101 kPa) 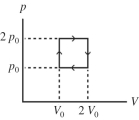
A) -1210 J
B) -485 J
C) -2280 J
D) -2420 J
E) -4850 J
Correct Answer:

Verified
Correct Answer:
Verified
Related Questions
Q15: A person tries to heat up her
Q22: The gas in a perfectly insulated
Q23: A lab assistant pours 330 g
Q24: A gas expands from an initial volume
Q25: The process shown on the TV graph
Q26: An athlete doing push-ups performs 650 kJ
Q28: During an isothermal process,5.0 J of thermal
Q30: How much energy must be added
Q31: The melting point of aluminum is 660°C,its
Q37: The work done on an ideal gas