Multiple Choice
The process shown on the TV graph in the figure is an 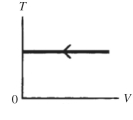
A) adiabatic compression.
B) isothermal compression.
C) isochoric compression.
D) isobaric compression.
Correct Answer:

Verified
Correct Answer:
Verified
Related Questions
Q15: A person tries to heat up her
Q20: Some properties of a certain glass
Q21: The figure shows a pV diagram
Q22: The gas in a perfectly insulated
Q23: A lab assistant pours 330 g
Q24: A gas expands from an initial volume
Q26: An athlete doing push-ups performs 650 kJ
Q27: The figure shows a pV diagram
Q28: During an isothermal process,5.0 J of thermal
Q30: How much energy must be added