Multiple Choice
Which graph shows data that are more suitable for regression analysis? 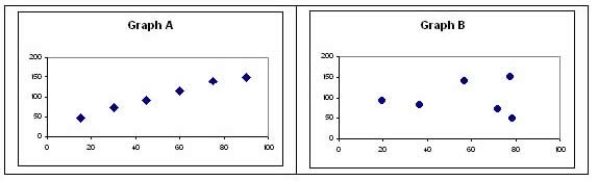
A) Graph A
B) Graph B
C) Neither Graph A nor Graph B
D) Cannot be determined
Correct Answer:

Verified
Correct Answer:
Verified
Related Questions
Q12: Past cost information, although accurate in predicting
Q38: In a regression equation, variable costs per
Q39: Simple regression analysis produces an equation of
Q41: An organisation's accountant is estimating next period's
Q44: Categorising costs by their behavior is one
Q45: Cost functions are most useful for estimating
Q46: This method of estimating future costs can
Q47: When the cost object is a unit
Q65: Steel used in the production of automobiles
Q69: Reviewing the pattern of a cost over